Read previous part: Combatting Mac OS X / iOS Malware with Data Visualization
Delving deeper into the features of Mach-O Viz software, Remy Baumgarten illustrates its visualization capabilities and demonstrates the tool in action.
The second part of the application is the Graph Visualizer. This contains three major areas, the first being the Interactive Graph Function Search, the second being the Security Assessment, and the third being the Graph/Data Display pane. I’m going to show you what all three of those look like, and then I’ll give you a demo of the application itself.
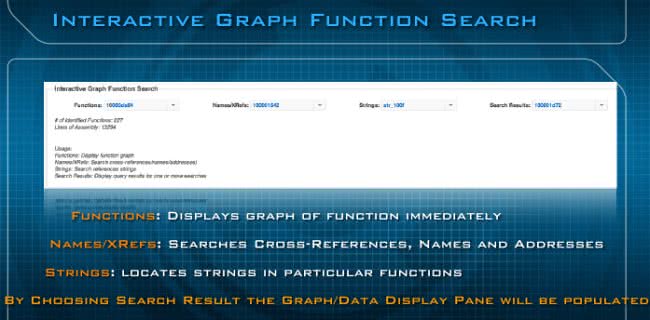
So, the first is the Interactive Graph Function Search (see image above), and at the very top left it says “Functions”, and it’s basically going to do analysis of the whole binary and give you a drop-down menu of all the functions in the application itself. When you select any of those functions it’s going to automatically draw the graph for you right below in the graph pane. The second and third one – the Names/XRefs and Strings – are going to list all the strings and cross-references for you, and when you select one of them it’s going to search the binary and then populate the results into the Search Results, the last drop-down menu on the right. Whenever you select the Names/XRefs or the Strings, remember that the Search Results is going to contain all the functions that are going to have any of those references that you looked at when you did those searches.
The second part is the Security Assessment (see image below). Right now, the way we’re doing it is we’re identifying the code segments which are using APIs and functions flagged as security risks. We’re also identifying and automatically generating the network and static file signatures for the binary. Basically, we’re doing this is two ways. The first way involves detecting network domains, IP addresses, URLs, web protocols embedded in the binary itself. And the second is calculating unique binary signature for the file itself using the Mach-O Magic value in the file’s header, plus unique 16 bytes from the binary’s string table.
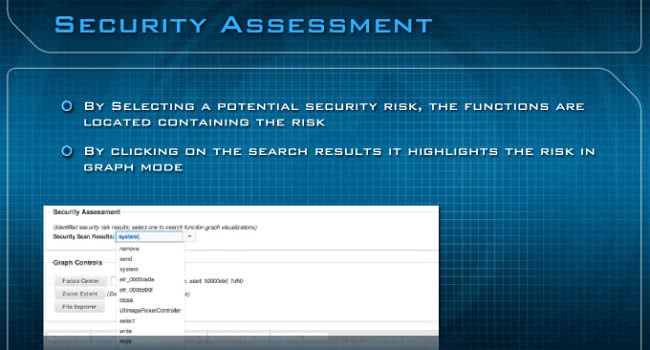
By selecting a potential security risk, the functions are located containing the risk (see image below). If you see the drop-down here you can see that I’ve selected the system function call. So, by actually selecting that, it’s going to fill in the search results, which you saw just a minute ago, and it’s going to show you all the functions in the application that are using that call in the application so you can drill down directly to the places where those potential security risks will be, so your analysts could look exactly what potential malicious behaviors might be inside that binary.
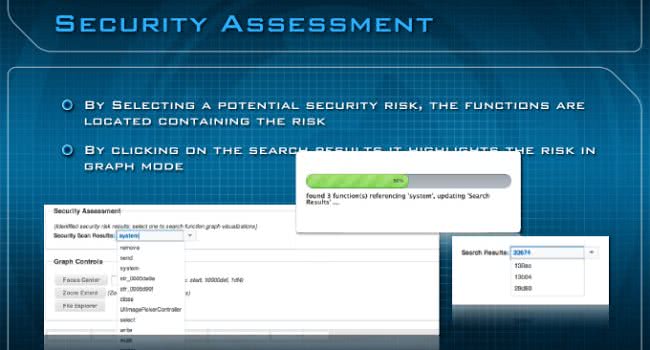
So, when I do that ‘system’, it’s actually doing this search right here. By clicking the security scan results system, where actually you could see this little popup here – that’s basically looking through the whole binary. We find three functions containing the reference to ‘system’, and then we update the search results containing that. So, if you look at the search results you’re going to see three functions where you could click on it. And right here you can see the actual search results – those are the functions containing the places you want to look at.
The bottom, the last part which contains most of the stuff you’re going to be looking at, is the Graph/Data Display pane. And this is divided into six tabs, the first being the Graph View (see image below), which is an IDA-like interface; it’s completely interactive, you can zoom, scale, highlight and do a few other things. You’re also going to have the Hex View, just like IDA. Also, Strings, Objective-C via class dump, Disassembly via LLVM-DIS, and also Network Security is going to contain your Snort Signatures.
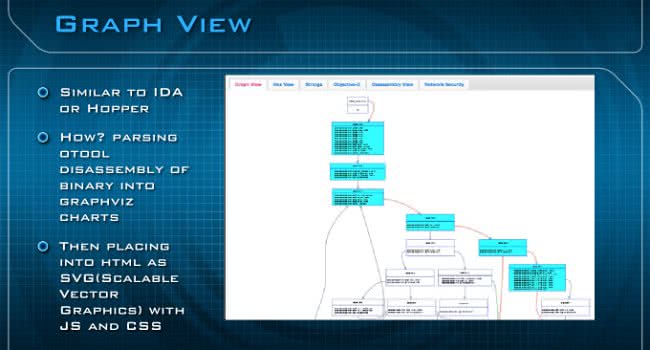
You can see the Graph View here, with a few highlights I’ve demonstrated. Again, it looks very similar to IDA or Hopper. How are we doing this? Basically, we’re parsing the otool disassembly of the binary, and then we’re doing a lot of magic to turn it into Graphviz charts. And then we’re taking those Graphviz charts into HTML and placing them as SVG with JavaScript and CSS to give you all the visual effects.
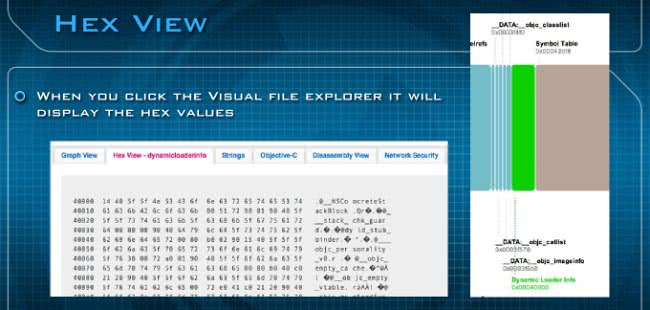
The Hex View – basically, you could click on the Visual File Explorer. In this case we’re clicking on Dynamic Loader Info which provides all the information you’re going to see for that particular type of information from the Visual File Pane. It’s going to be hex values. This is what the hex values view looks like (see image above). This is the second pane.
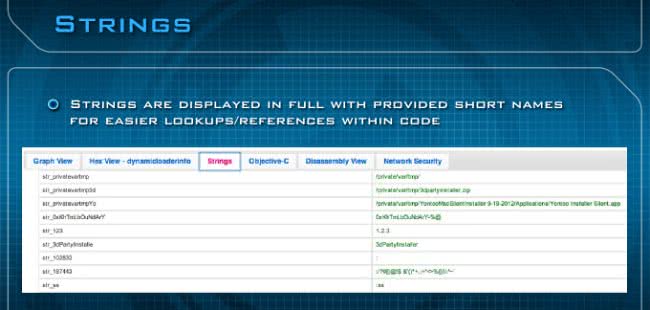
The third pane is the Strings (see image above). The Stings are provided with short names on the left for easier lookup references within the code. If you look at disassembly by itself with the tools Apple provides, it doesn’t give you short names, so we had to develop an algorithm to actually do this and then have a cross-reference to a particular area within the file format itself, where these strings actually existed. So this is a little bit tougher than it looks.

For the Objective-C part (see image above), we’re using class-dump here. Class-dump generates headers from Mach-O files; if you’re not familiar with it, it’s a reverse-engineer’s ‘wet dream’ if you’re dealing with Mach-O file format. It’s awesome, and I’ll show you an example of how effective that is.
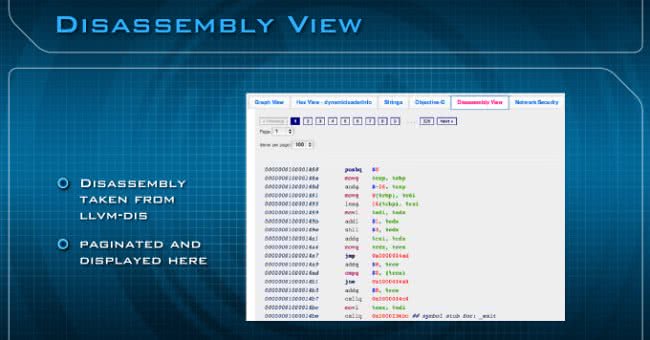
The next panel is the Disassembly View (see image above), and this is taken from LLVM disassembly. We’re paginating here so you could change how many lines you want and then just change pages.

The last tab, which is most useful to the network analyst, is the Network Security pane (see image above). Here you can see we developed some Snort signatures, and you can see some URLs, and you can basically plug and play these right into your IDS system. These are going to contain domains, IP addresses, URLs and protocols, if you in fact find that the file itself is malicious. The bottom is the file signature, and, again, we’re doing that unique 16 bytes from the string table that I talked about earlier.

With that, let me give you a demo of two examples of analyzing different samples. The first is Yontoo Trojan, and the second is Mac Defender. A little bit of background about both: the Yontoo Trojan infects Chrome, Firefox and Safari in Mac. It uses social engineering to install an ‘HD plugin’.
I’ll now pull up this video (watch demo video above). On the front page I’m going to select the Yontoo Trojan which is called Custom Installer, and I’ll upload it. At this point, it’s going to analyze and generate the graphs; it will analyze all the assembly of the file, break apart all the functions, create SVG files, and then it’s going to do some optimization to minimize the network load. It will also calculate the entry point. So, this is what it looks like. I’m opening up the header, and you can see a few different values. Again, I clicked on the top level and I’m looking at the load commands, and you can see all the different load commands here. Then I’m going to go down at the bottom and quickly look at the security assessment, and you can see that there’re 16 security risks that we deem are essential to look at.
With that, there’re a few things I want to show you. I can open up the Graph View, you can see I can move it around. I can also access the Strings view, where you can see a bunch of potentially interesting URLs and file locations that are kind of sketchy that might immediately pop out to you. With the Objective-C, this is class dump; I found a really interesting method that is called Extension Installer, it’s immediately pointed out. One of the methods here is called Install Safari Extension. Basically, you can see here an address. What I’m going to do is I’ll copy that address and plug it right into the functions, and it will automatically generate the graph for me and then display this particular method. This way we can look at what exactly is going on in this installation method itself.
For the Graph View, you can see the whole graph by clicking Zoom Extents. Then you will see the entire method displayed within one screen. I’m going to zoom in and show you a few different things of what exactly is happening within this installation itself. The first thing you can see is str_LibrarySafariEx, and that is a short name for the string which you can see at the bottom; that’s the URL which is the location of the directory of where they’re going to want to install this. The next thing you’re going to see is Safari extensions plist short name, and I’ll go ahead and find that string over here and see what exactly that means. It’s actually Extensions.plist. So, what I can kind of infer right now is that they’re actually modifying the extensions plist for Safari.
Looking further down in this routine, I’m basically looking for something else; probably they’re going to write a value. So, taking a look further into this I’m going to zoom in and see that, essentially, there’s going to be a string called ‘str enabled’, and they’re going to be writing a ‘1’ to it. There is an easier way to do this, I just wanted to show you the hard way. For the strings, basically, I could have just gone to the ‘str Safari extension’ and it would show me the exact same graph that I pulled up before. This is the reverse of what I was just doing.
The next one is Mac Defender (watch demo video above), and we’re going to build this chart right here. I just want to point out that Mac Defender actually has multiple architectures, that’s why you saw two big blocks: one of them was x86 and the other one is x64. For this, it’s really interesting because what we’re going to do right here is we’re going to find a method called ‘is file infected’, because Mac Defender is a fake antivirus.
By pulling this method up, we can see the entire routine that is going to be used for the actual virus detection for this application, or this malware. We can see here the whole antivirus routine. Looking closely, you can see that, basically, this is the world’s smallest AV file infection detection routine. It uses a random number generator for ‘scan’ time.
The last thing I want to show you today is the Network Security. This is, basically, what you get at the end: Snort sigs – these are mostly porn URLs. This application is going out to the net and hitting a bunch of porn URLs, you can see this on your Snort database right here.

With that, let me give you the links for this presentation (see image above). At the top is the beta URL. And below is the slides’ URL too. The white paper is also listed on this Mach-O Viz beta URL.
